

Quantities that follow the ground
Terrain cross-sections, side-hill formation, geology reaches, mass haul and parcel acquisition support the capital estimate.
NewDetailed estimatesBridge workspace
Railway engineering, in your browser
Turn a corridor into a railway alignment you can inspect, improve and compare.
Route across terrain, or develop a climb through hills. Refine the geometry. Develop the bridges and yards, then see the works in 3D. Measure and price each component, and understand the cost of building and running the line.
No installation. Editable geometry. Your engineering judgement.
Design and explore for free. Pro adds more alternatives, Cab ride 2, project sharing, team editing and engineering exports. Compare Free & Pro.
Ch 42 to 51 · Broad gauge
Actual application · not concept artwork
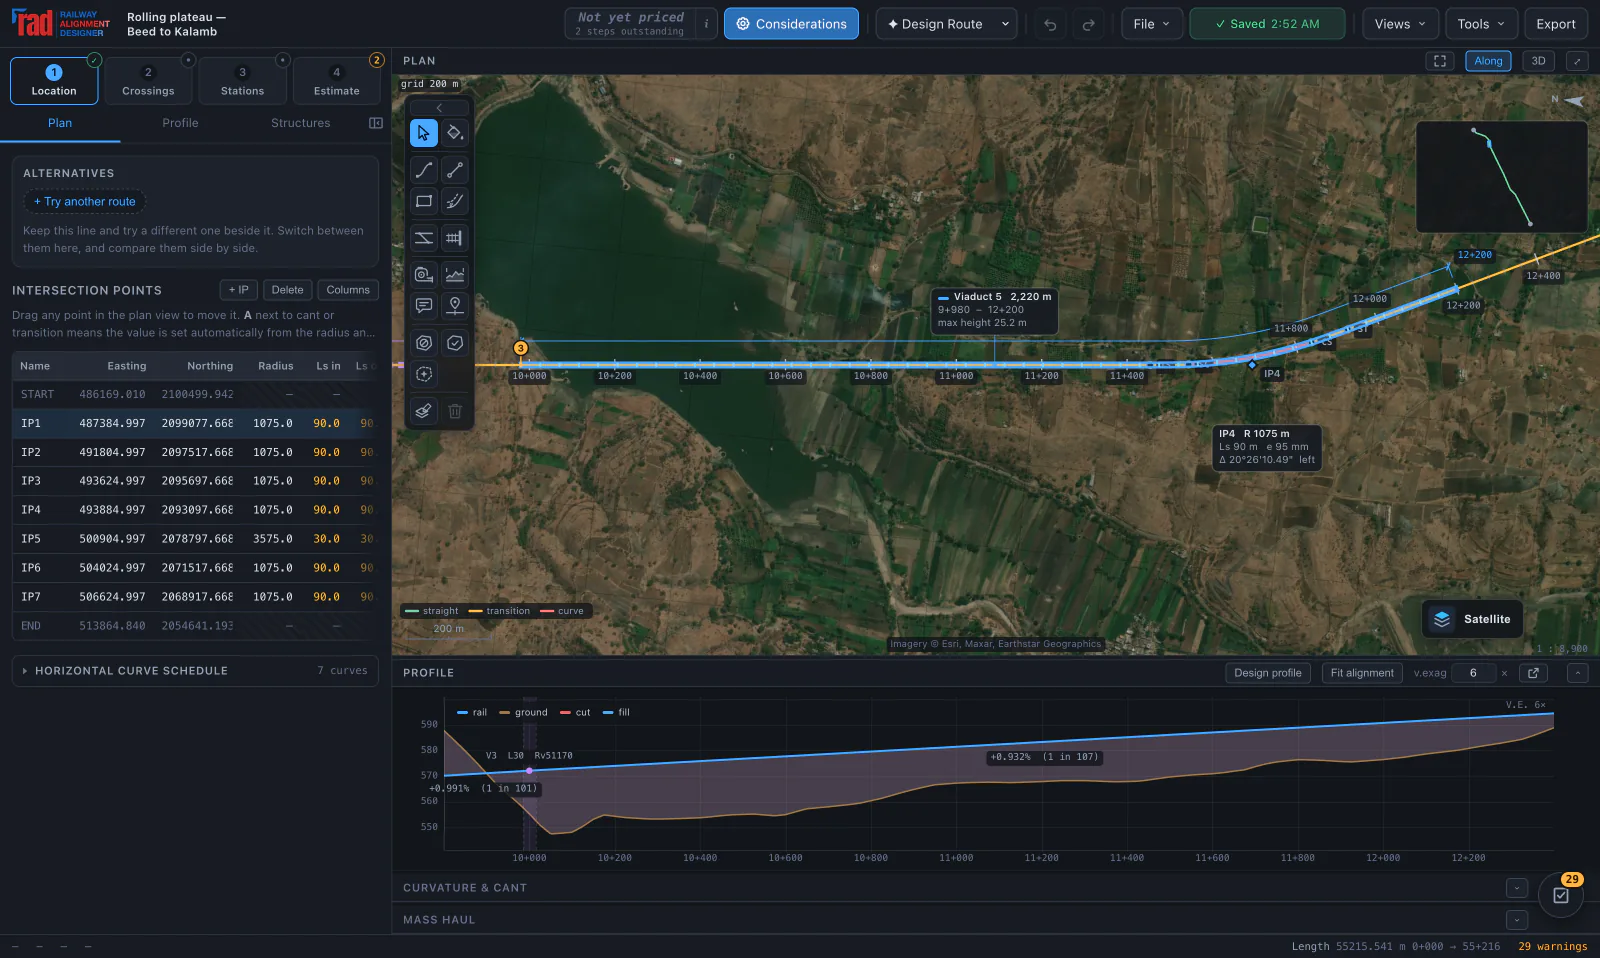
The plan, profile, works and ride are different views of the same editable alignment. Move the geometry and inspect the updated checks, automatic quantities and drawings. Your detailed estimate stays a saved, editable bill until you choose to revise it.
Engineering, in motion
Scroll to follow the design
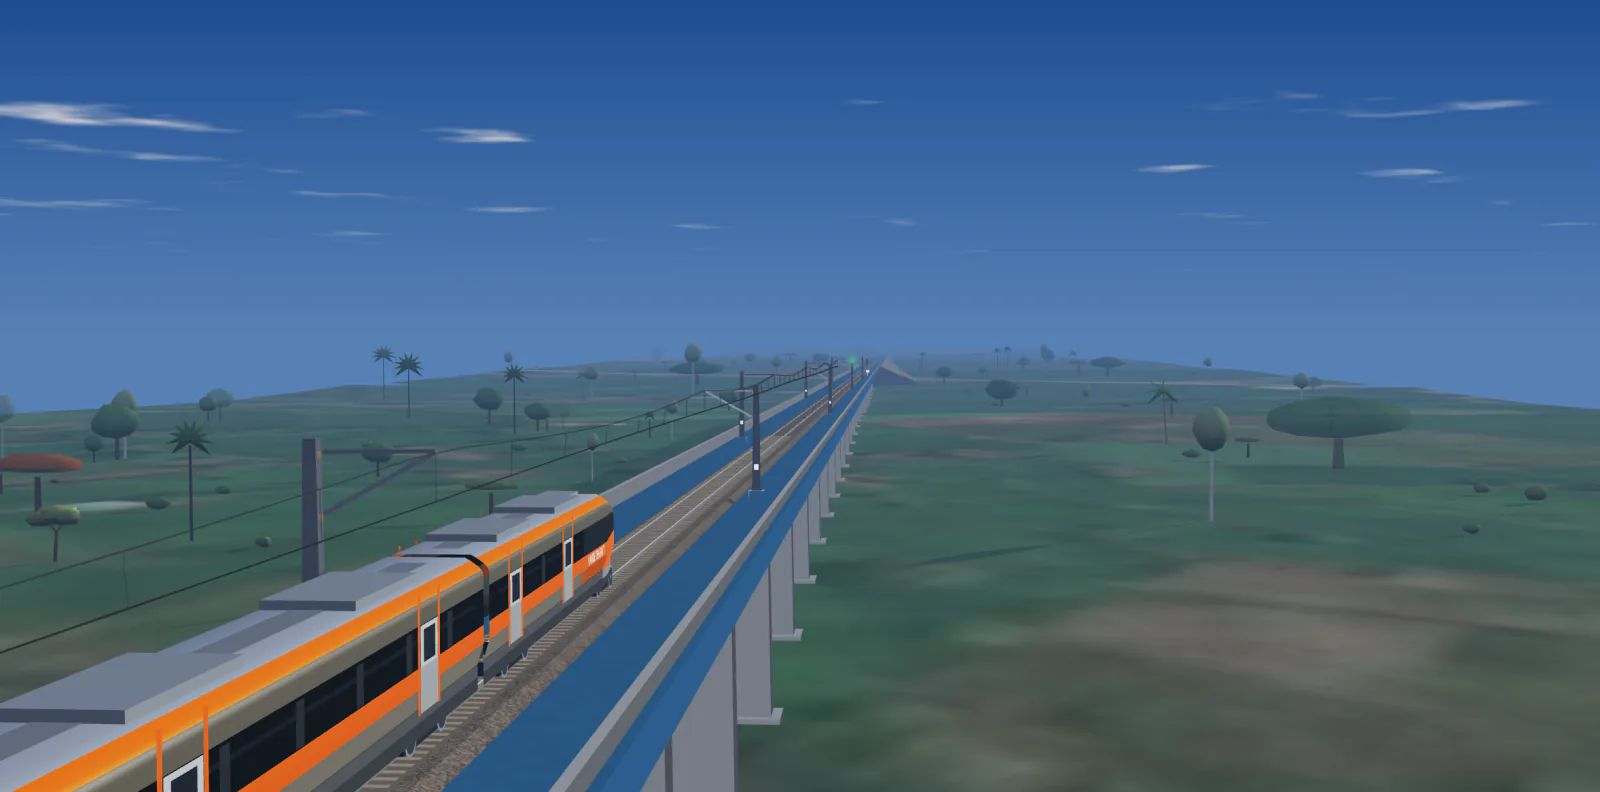
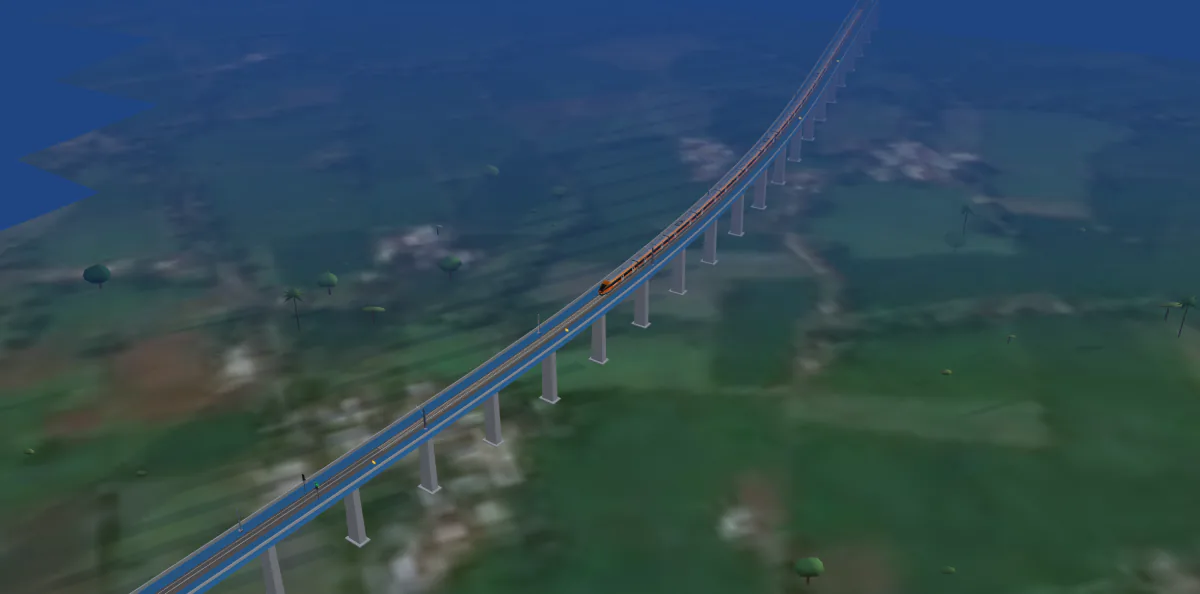
Illustrative scene. The designer’s cab ride follows your project geometry; this artwork is not operational validation.
01 / A connected workflow
Start automatically or draw by hand.
Inspect and edit the design at every stage.
Set endpoints and required stops. Route over terrain, develop a climb through hills, or follow an existing railway for doubling and additional tracks.
LocationReview roads, rivers and utilities. Delineate catchments, propose structures and consolidate minor road crossings.
CrossingsArrange loops, turnouts, platforms and sidings. Fit station plateaus into the profile and inspect the solved yard.
StationsStart blank or import the alignment quantities as a snapshot. Measure and price separate component bills with USSOR and DSR items, then combine them in a summary with visible unpriced and provisional items.
Estimate02 / Hill country
When the ground rises faster than the ruling gradient allows, the shortest corridor has no answer.
Mountain route development holds your design speed, ruling gradient and end levels, and searches for a longer way up. Every candidate is solved in plan and profile and checked before it is kept.
A bounded search, not a proof: when it finds no compliant route, the corridor may still have one. Climbing-loop crossings stay conceptual until their structures are designed.
130 km/h · Ruling gradient 1 in 100
03 / Inside the designer
PLAN / PROFILE / CURVATURE & CANT
Drag control points in plan or profile, or type an exact move. The alignment re-solves into straights, clothoid transitions and circular arcs, with cant and vertical geometry on the same chainage.
GLOBE / TERRAIN / EARTHWORKS
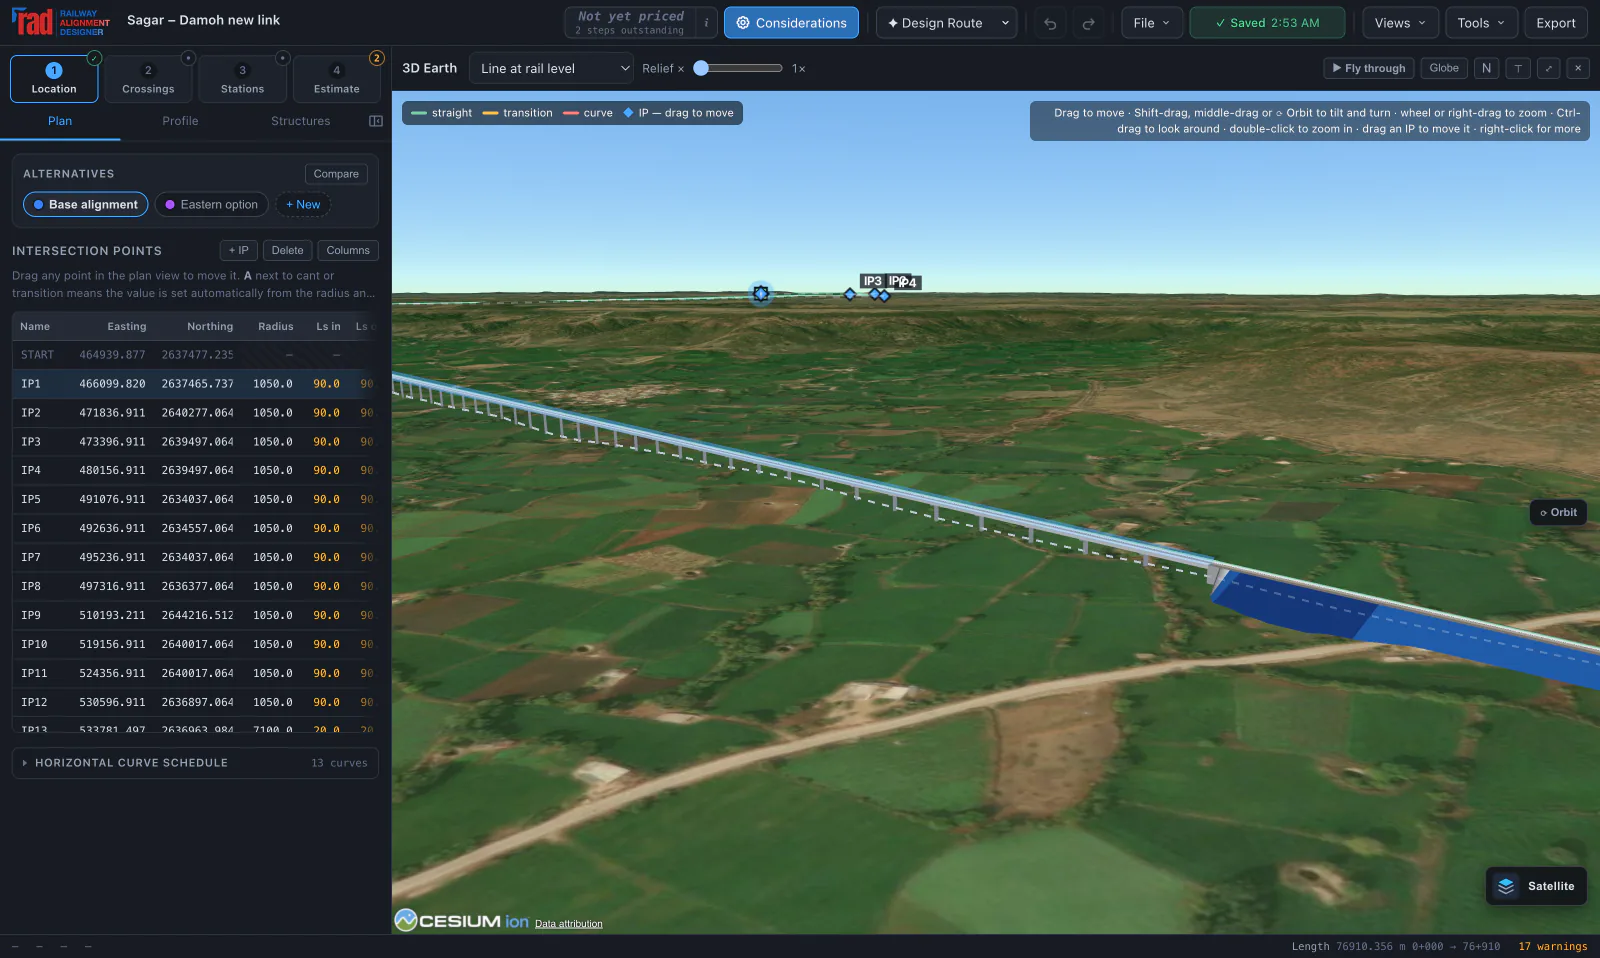
Raise the plan onto a 3D globe of streamed terrain and imagery. It opens on the satellite picture with the design line and its IP legs; switch on the banks, cuttings, viaducts, tunnel portals, track and station yards to stand them on the ground, and drag the line’s points there as on the plan.
CROSSINGS / BRIDGE WORKSPACE / GAD
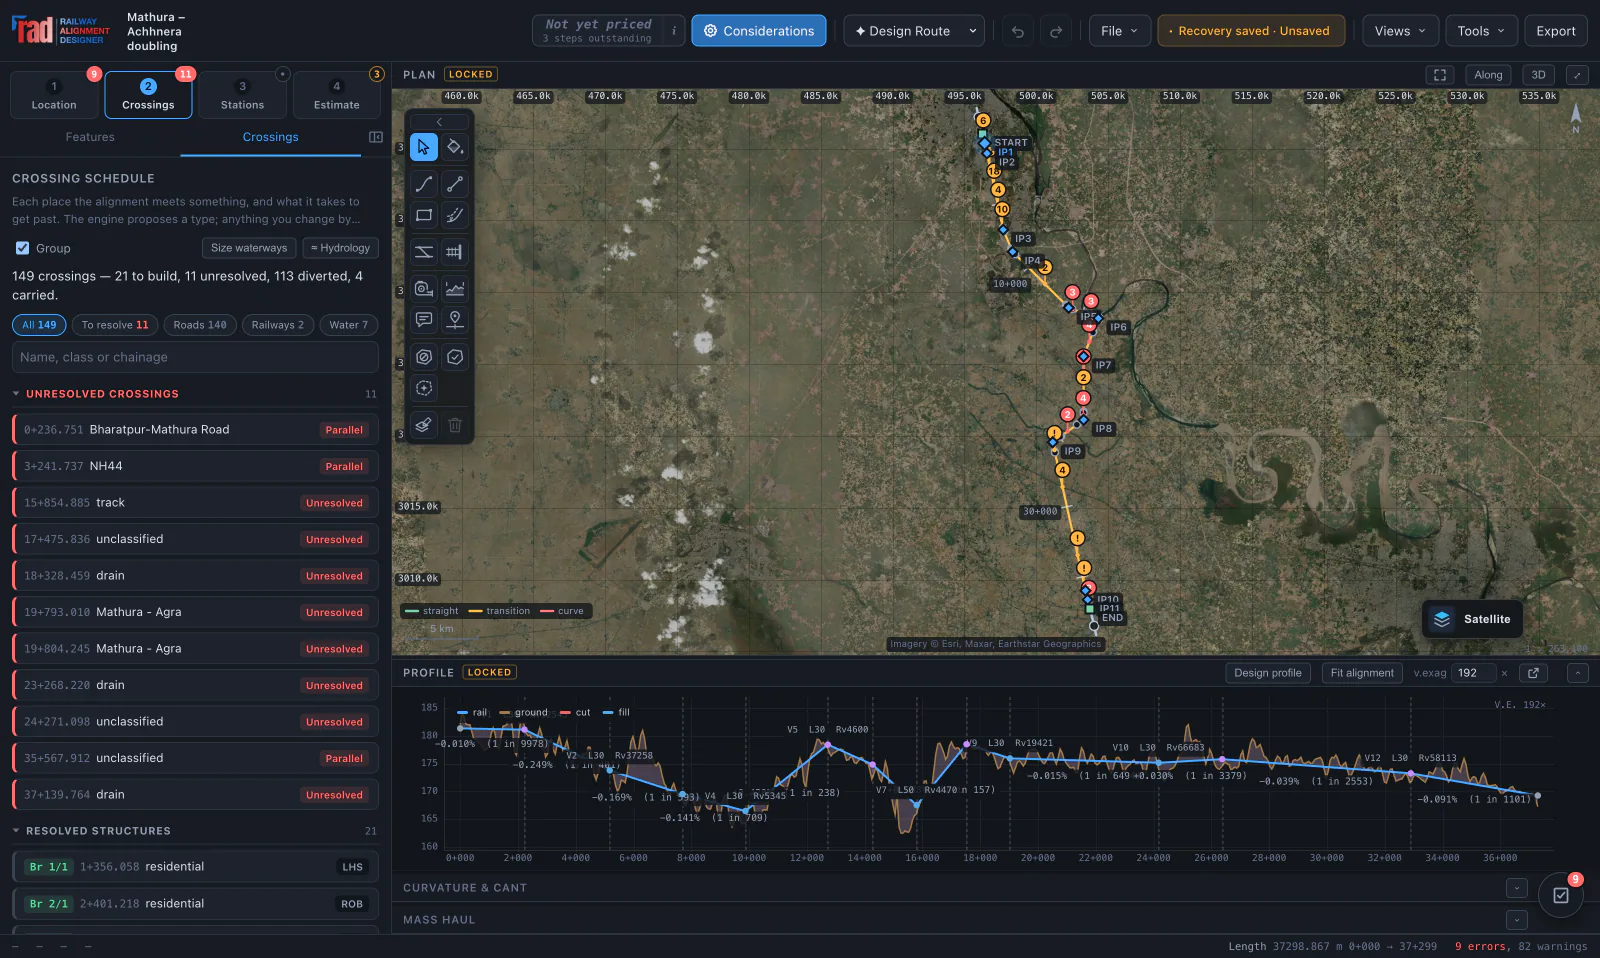
Review the mapped roads, watercourses and utilities. Open a bridge workspace to edit spans, supports and foundations, with wing and return walls connected to the retained approach. Inspect the same arrangement in 3D and on its drawing sheets.
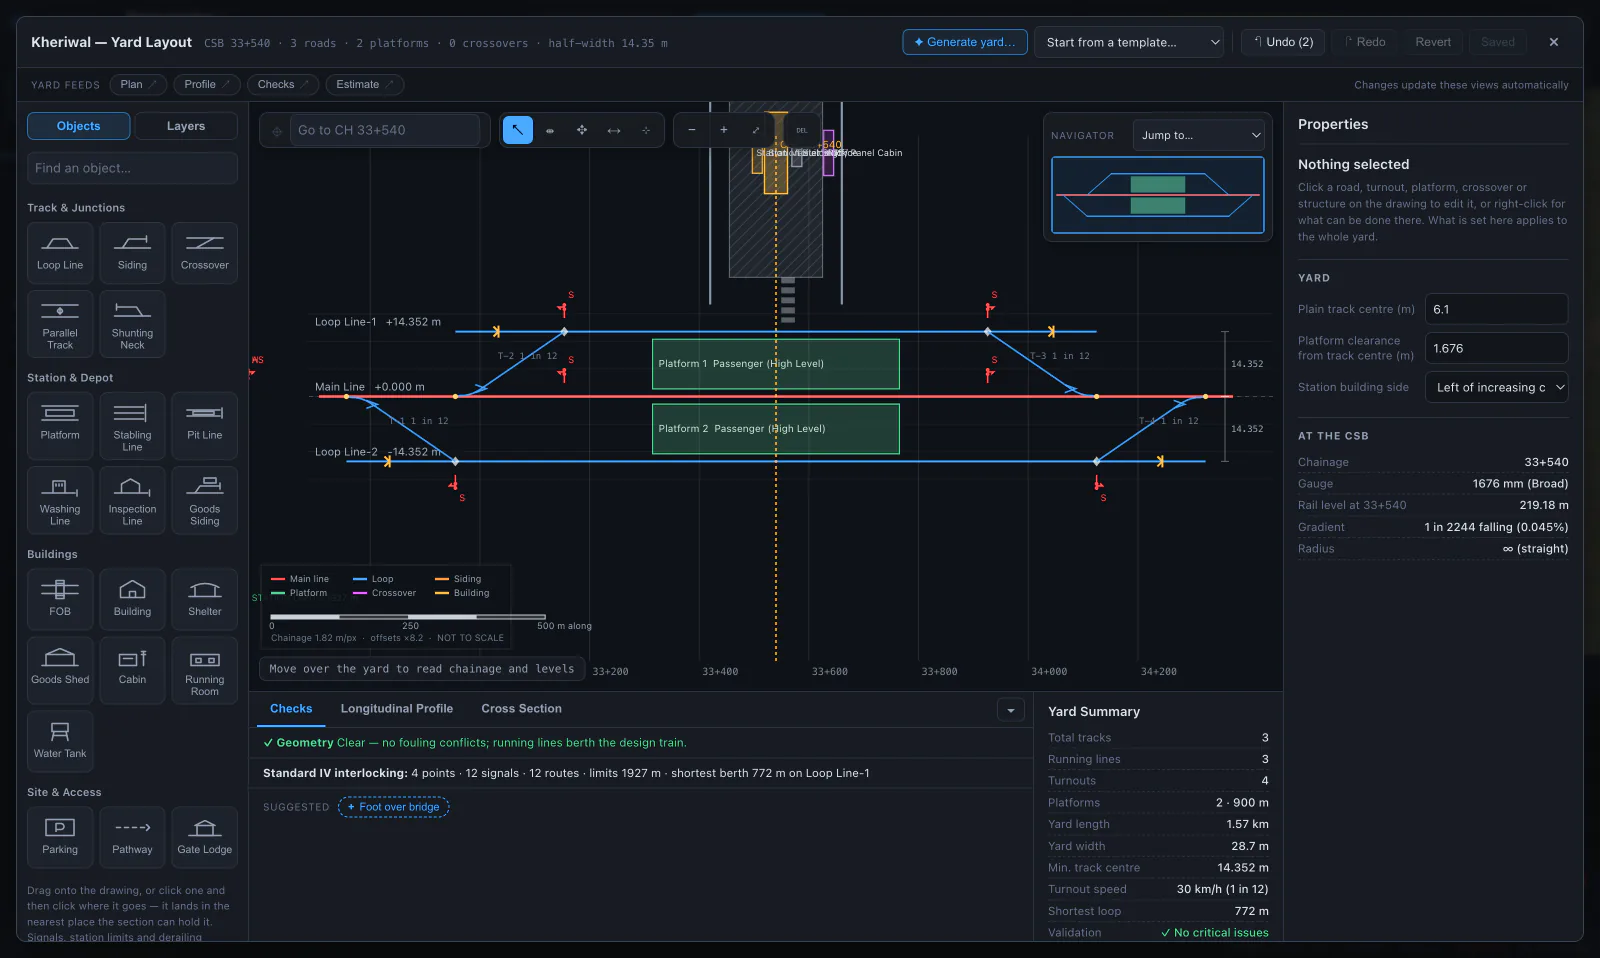
LOOPS / PLATFORMS / TURNOUTS
Edit conceptual station layouts, then see their roads, platforms and formation reflected in the drawings, cross-section, 3D view, cab ride and estimate.
CAB RIDES / ORBIT / CHASE / LINESIDE
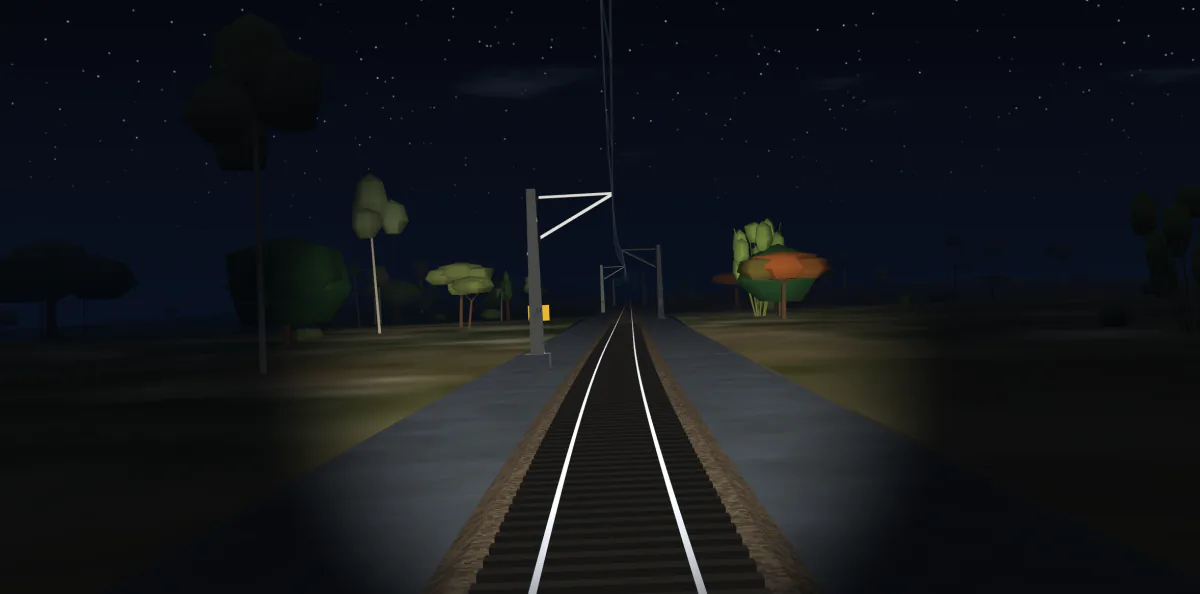
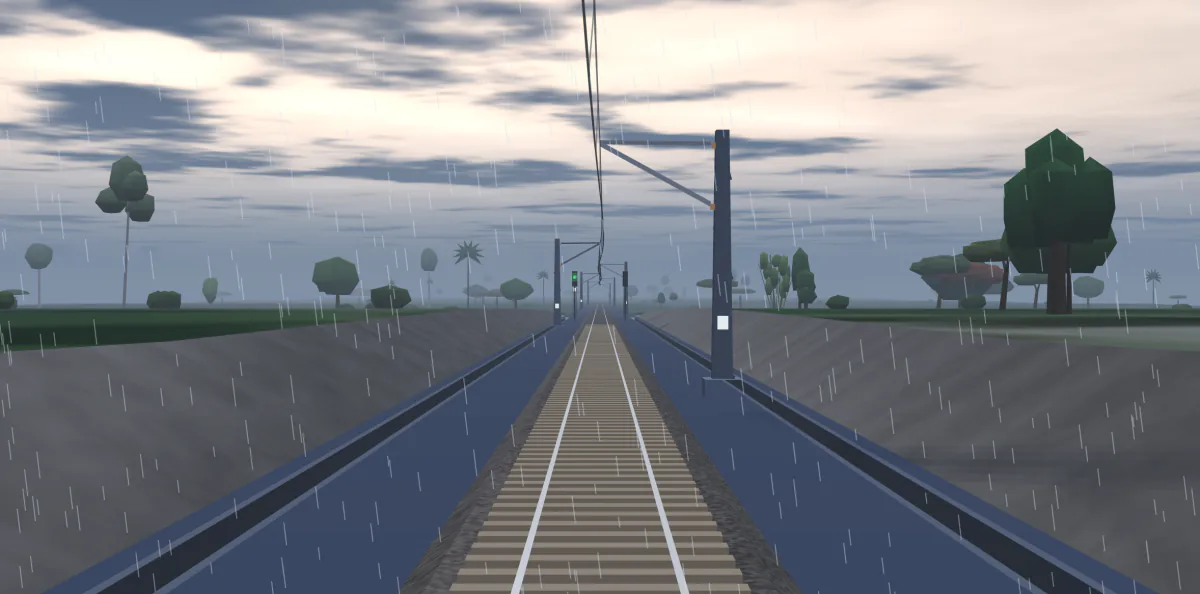
Ride the alignment in either direction and inspect its stations, structures and earthworks. The original ride offers time of day, weather and station calls. Cab ride 2, included in Pro, adds a separate 3D viewer with cab, orbit, chase and lineside cameras, detailed station scenes and cutting drainage.
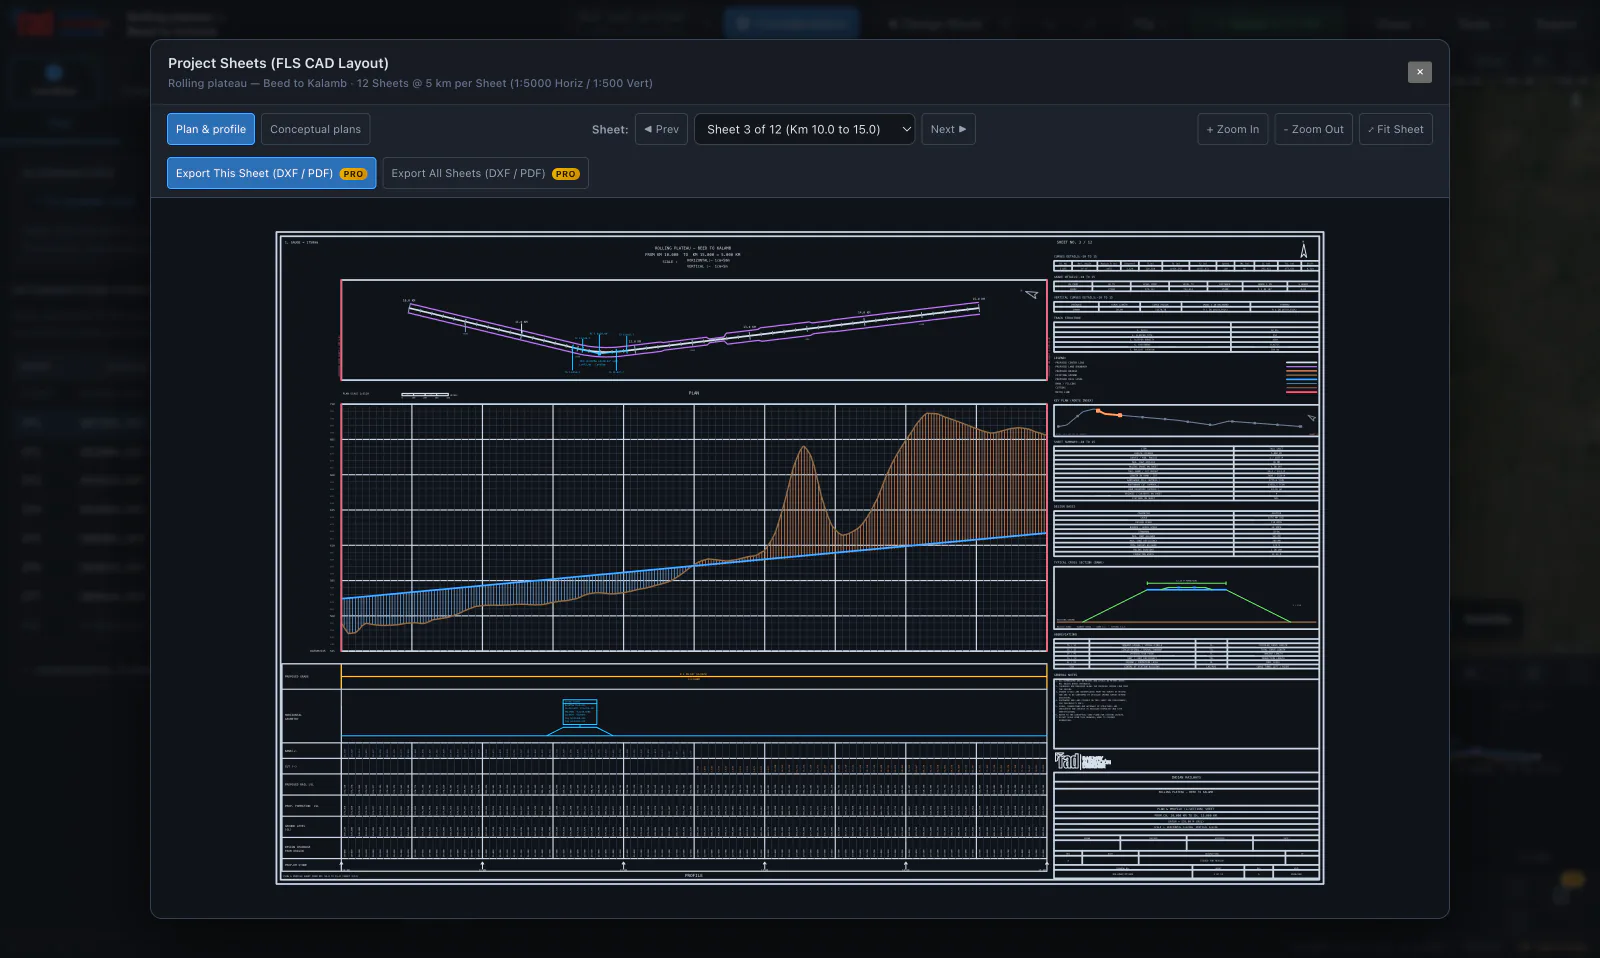
PLAN & PROFILE / SHEET VIEWER
Inspect the plan and longitudinal section in sheet packages, with curve information, chainages and title blocks read from the alignment.
ORIGINAL CAB RIDE / HOUR / WEATHER
Real captures of one design, with nothing painted in.
04 / Detailed estimates New
From measured items to the general summary,
with the rate basis kept beside the figures.
Give each bridge, station or works package its own bill. Start blank, or import a fixed snapshot of the alignment estimate and develop it into a detailed estimate.
Enter quantities or build count × length × breadth × depth measurements, with deductions and explicit unit conversions.
Search 4,249 catalogue item variants. Keep the source code and billing unit, enter a project quotation, or analyse material, labour and equipment costs.
Combine included components by head, split cash and stores, and set estimate charges. Unpriced items and provisional allowances stay visible for review.
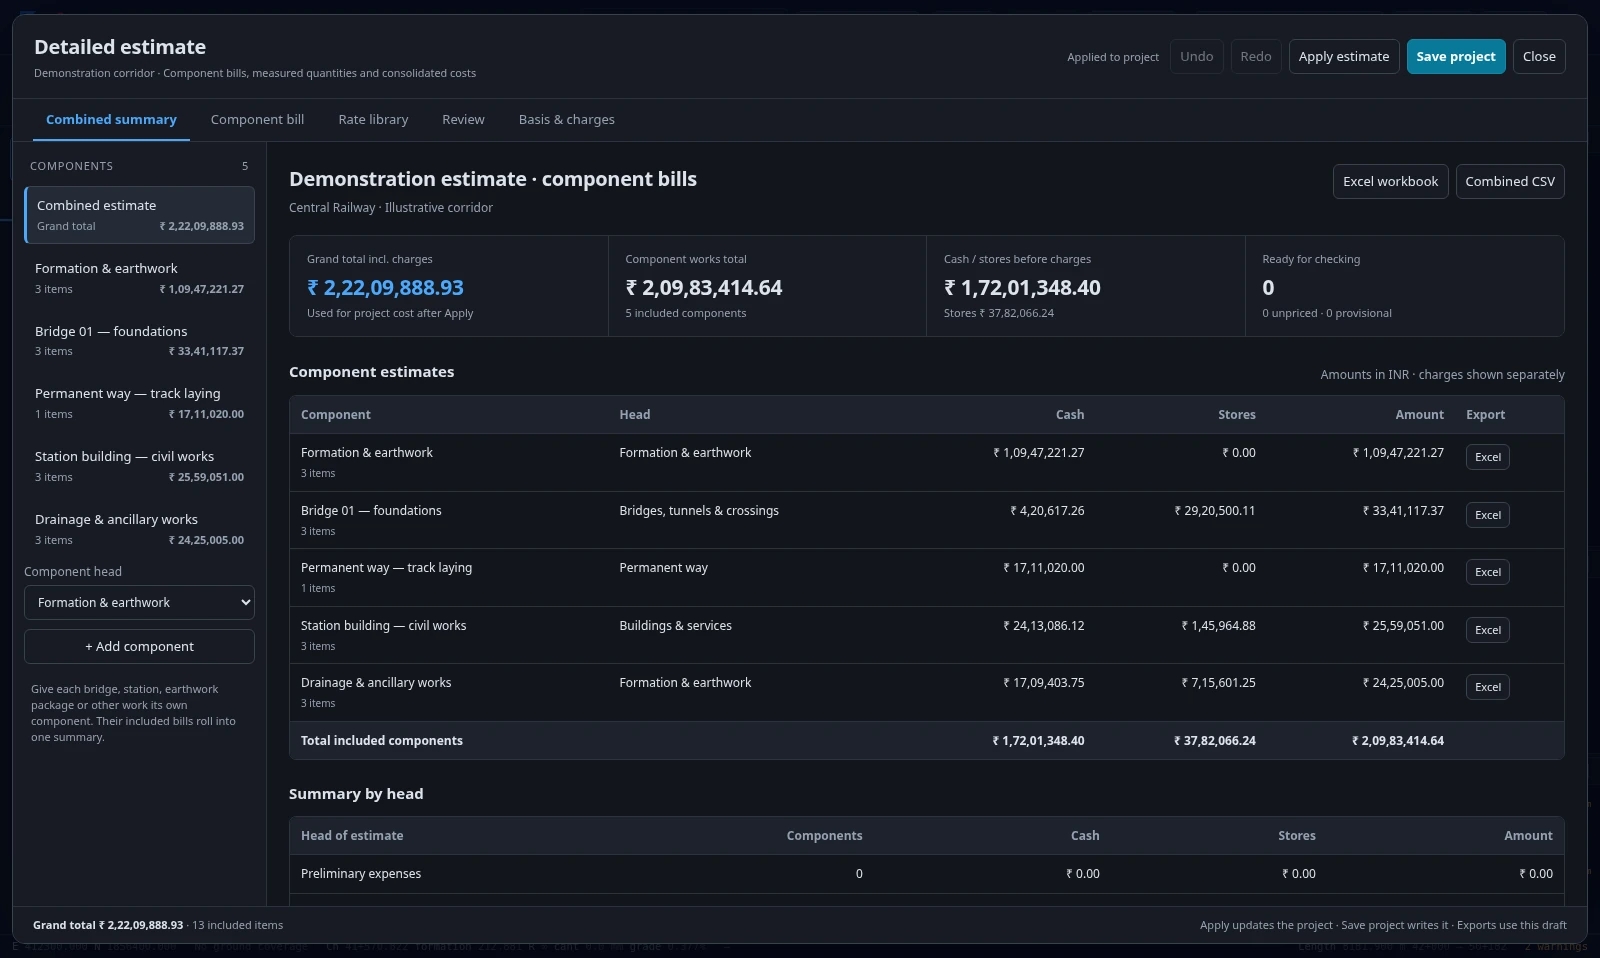
CENTRAL RAILWAY USSOR 2021 / CPWD DSR 2023
The library uses Central Railway and Delhi rates. The estimate reads the project’s zone and location; enter verified local indices or project rates and record their authority.
THE BILL AND ITS WORKINGS
Export one component or the combined estimate to Excel, with linked measurements, rate analyses and summaries. CSV is available for tabular handover.
Build, edit and save estimates in Free.
Excel and CSV exports are included in Pro
05 / Beyond the centre line
Keep alternative alignments in the project. Compare what changes on the ground, in the quantities and over the life of the railway.
Open a project with an alternativeTerrain cross-sections, side-hill formation, geology reaches, mass haul and parcel acquisition support the capital estimate.
Model running time, traction energy and regeneration in both directions. Compare diesel and electric operation, energy and carbon.
Appraise capital, maintenance, energy and renewals together. Test discount-rate sensitivity and the point where options change places.
Explore P50, P80 and P95 cost risk, ranked uncertainty drivers and the speed–cost trade-off. Optimise with a trace you can inspect and rewind.
06 / Engineering judgement stays in the loop
A useful design shows its workings.
And the gaps in what it knows.
Save projects with their collected OpenStreetMap corridor data, detailed bills and adopted rates. Reopen the saved corridor without repeating its OSM lookup; terrain tiles can download again. With Pro, share viewer or editor access and collaborate on the design. Keep revision history and compare the design, quantities and cost.
The Project centre keeps the project’s open work beside the design: field observations with photos and GPS, team tasks with due dates, a construction programme and a traffic capacity check.
Survey provenance, geology and an assumptions register make missing information visible. Cloud saves flag revision conflicts.
Your account & projects“Which option uses less traction energy, and why?”
The assistant calls the design engines and explains their results. Changes are proposed for your approval before they are applied.
Use a supported provider with your own key, or the shared allowance where configured. Shared access requires sign-in.
Ask about your alignment07 / Take the work with you
Move from an editable project
to your CAD, spreadsheet and review workflow.
Pro exports the complete engineering package. Drawing previews, detailed estimate editing, basic curve and compliance CSVs, and local .rads project backups are included in Free.
Local .rads files and browser recovery drafts support your work alongside cloud projects. Older .rads and .radsupport pairs remain importable. After opening the designer online, cached application and available terrain support offline use; streamed imagery, new map lookups and missing terrain need a connection.
Free & Pro
Explore the complete design workflow.
Choose Pro for more alternatives, collaboration and deliverables.
Route, edit and check your alignment, with one alternative beside the base route. Inspect the terrain, works and original Cab ride.
Everything in Free, with more route alternatives, Cab ride 2, shared projects and engineering deliverables.
Request access in your account. An administrator reviews it; you can follow its status and refresh access in your profile.
| Feature | Free | Pro |
|---|---|---|
| Design, edit and check alignments | Included | Included |
| Terrain, 3D Earth and original Cab ride | Included | Included |
| Alternatives beside the base route | One | More than one |
| Cab ride 2 | Not included | Included |
| Windows & Mac desktop app | Not included | Pro desktop downloads |
| Personal cloud projects and single-file .rads backups | Included | Included |
| Create review links and share cloud projects | Not included | Included |
| Team editing and cloud review comments | Read-only viewing | Owner and participants need Pro |
| Detailed estimate editing and saved rate library items | Included | Included |
| Drawing previews and curve / compliance CSVs | Included | Included |
| Full CAD, PDF drawings, LandXML and KML exports | Sample downloads | Your project exports |
| Detailed reports, estimate Excel / CSV, and comparison schedules | Sample report | Your project exports |
| Cab ride MP4 export | Not included | Your project film |
Both plans support preliminary design and appraisal. Outputs require project-specific data and qualified engineering review before submission or construction.
Inspect the output
Generated from the mainline worked example. These are demonstration files with indicative inputs, for inspecting the formats.
08 / Start with a worked example
Open the actual project in the designer.
Inspect the geometry. Try a different answer.
Doubling beside an existing railway. Parallel running, tie-ins and terminal yard context.
A new link across the Vindhyan plateau, with an eastern alternative stored in the project.
A long Thar corridor for exploring sectioned terrain, vertical geometry and drawing packages.
Study terrain is real. Mapped corridor features in these three projects are synthetic fixtures.
Yes. Pin obligatory points, set the ruling gradient or let the ground choose it, draw avoidance or inclusion areas and paint routing costs. Then edit the control points, radii, cant and vertical profile by dragging, snapping or typing an exact move. Compliance checks and repair tools help you assess the result; they do not replace your decisions.
Within limits. Mountain route development holds the design speed, ruling gradient and end levels, and searches longer routes: contour traverses, broad horseshoes and, if you allow them, climbing loops with grade separation. It is a bounded search, so finding no compliant candidate does not prove the corridor impossible, and loop crossings still need structural design. The live demonstration runs on synthetic terrain.
Route design and editing, one alternative beside the base route, compliance checks, terrain and 3D Earth, the original Cab ride, drawing previews, detailed estimate editing, curve and compliance CSVs, and .rads project backups stay free. Pro adds further alternatives, Cab ride 2, creating review links, project sharing, team editing and engineering exports. Viewing an issued review link or a shared project remains free. Sample deliverables are available above without signing in.
Sign in and submit an access request from your profile. An administrator reviews it, and you can see the status and decision note in your account. Approval normally grants 365 days; the administrator can choose 30 days, 90 days or no expiry. After approval, refresh access in your profile. This request does not take payment or send an email.
You can explore worked examples and open read-only review links without an account. A free account lets you design and save your own routes and use the configured shared assistant allowance. Creating review links and sharing projects require Pro; team editing and cloud review participation require Pro for the owner and each participant. Projects can also be saved as local files. The mountain route demonstration runs without an account.
Cloud saves keep the collected OpenStreetMap corridor data, so reopening the saved corridor can reuse it. DEM terrain may download again. Local saving produces one .rads file with OSM data, available terrain and your detailed estimate. Older .rads/.radsupport pairs remain supported. Older cloud projects may need one lookup and a new save to retain their context; changing the corridor or refreshing the map data can require another lookup. Read the saving guide.
No. Public SRTM-derived terrain is roughly 30 m resolution and supports preliminary corridor appraisal; the 3D view stands on the same ground. Import surveyed ground and verify control, geology, clearances and the governing standard before relying on quantities or setting-out. Standard presets and conceptual yards require project-specific review.
Each finding identifies the measured value, limit, rule and remedies, and is pinned on the plan where it occurs. Automatic repairs re-solve the geometry, and Redesign reports what it changed, including any radius you had set by hand. Conditions requiring a route change, new information or engineering judgement remain for you to address. Departures and missing information should be reviewed before issue.
Your next corridor starts here
Explore a worked example without signing in, or create an account to design your own route.
Start a route or open a worked example and see how the pieces fit.
For preliminary design and appraisal. Survey control, authoritative project data and engineering review are required before construction or formal issue.